Zoho Analytics isn’t just another business intelligence tool; it’s your all-access pass to unlocking the power of your data. Think of it as your super-charged spreadsheet on steroids, letting you visualize, analyze, and share insights with ease. Whether you’re a small startup or a large enterprise, Zoho Analytics offers a flexible and intuitive platform to tackle even the most complex data challenges.
Table of Contents
This deep dive will cover everything from basic functionalities to advanced techniques, making you a Zoho Analytics pro in no time.
We’ll explore its core features, from data import and transformation to report and dashboard creation. We’ll also compare it to competitors, delve into its security features, and show you how it integrates seamlessly with other Zoho apps. Get ready to ditch those clunky spreadsheets and embrace the efficiency of Zoho Analytics!
Zoho Analytics Overview
Zoho Analytics is a cloud-based business intelligence (BI) and data visualization tool that helps businesses collect, analyze, and present data effectively. It’s designed to be user-friendly, even for those without extensive data analysis experience, and offers a range of features to suit various needs, from simple reporting to complex data modeling. Its core functionalities include data import from multiple sources, data cleaning and transformation, report creation with interactive dashboards, and data sharing capabilities.Zoho Analytics caters to a broad audience, encompassing individuals, small businesses, and large enterprises.
Its intuitive interface makes it accessible to non-technical users who need to understand their data, while its powerful features satisfy the needs of data analysts and business intelligence professionals. The platform’s scalability allows it to adapt to businesses of all sizes, from startups tracking key metrics to multinational corporations managing vast datasets.
Target Audience for Zoho Analytics
Zoho Analytics is useful for a variety of roles within an organization. Marketing teams can use it to analyze campaign performance and customer behavior. Sales teams can track sales trends and forecast future revenue. Finance departments can monitor financial performance and identify areas for improvement. Operations teams can analyze efficiency and identify bottlenecks.
Essentially, anyone who needs to make data-driven decisions can benefit from Zoho Analytics.
Industries Using Zoho Analytics
Zoho Analytics finds applications across numerous sectors. In the retail industry, it helps analyze sales data, track inventory, and understand customer preferences. In manufacturing, it facilitates the tracking of production metrics, quality control, and supply chain management. Healthcare providers utilize it for patient data analysis, improving operational efficiency, and tracking key performance indicators (KPIs). Financial institutions leverage Zoho Analytics for risk management, fraud detection, and regulatory compliance.
The adaptability of the platform makes it a valuable tool for organizations in diverse fields.
Key Features and Capabilities
Zoho Analytics is more than just a data visualization tool; it’s a comprehensive business intelligence platform offering a powerful suite of features designed to help users extract actionable insights from their data. Its strength lies in its accessibility, combining a user-friendly interface with robust analytical capabilities, making it suitable for both casual users and experienced data analysts. This section will delve into the key features and capabilities that make Zoho Analytics a compelling option in the BI market.
Data Visualization Tools
Zoho Analytics boasts a wide array of data visualization tools, allowing users to represent their data in various formats to suit their needs and preferences. From simple bar charts and pie charts to more complex visualizations like heatmaps, geographical maps, and even custom dashboards, the platform offers considerable flexibility. Users can easily create interactive dashboards, allowing for dynamic exploration of data and the identification of trends and patterns.
For example, a marketing team could use a geographical map to visualize sales performance across different regions, while a finance team might leverage interactive dashboards to monitor key financial metrics in real-time. The platform also allows for the creation of custom visualizations, catering to specific analytical needs beyond the standard options. These visualizations can be easily embedded into other applications or shared with colleagues, facilitating collaboration and knowledge sharing.
Feature Comparison: Zoho Analytics vs. Tableau
The following table compares Zoho Analytics to Tableau, a prominent competitor in the business intelligence space. Both platforms offer robust capabilities, but they cater to different needs and user preferences.
| Feature | Zoho Analytics | Tableau | Notes |
|---|---|---|---|
| Pricing | Subscription-based, various tiers available, often more affordable than Tableau. | Subscription-based, generally more expensive, particularly for enterprise-level solutions. | Cost is a significant factor for many organizations. |
| Ease of Use | User-friendly interface, relatively easy to learn and use, even for non-technical users. | Steeper learning curve, requires more technical expertise to fully utilize its capabilities. | Zoho Analytics prioritizes accessibility, while Tableau offers greater customization for advanced users. |
| Data Integration | Supports a wide range of data sources, including cloud databases, spreadsheets, and CRM systems. Offers robust connectors and APIs. | Excellent data integration capabilities, supporting a vast array of data sources, including specialized big data solutions. | Both offer strong integration, but Tableau might be preferred for extremely large or complex datasets. |
| Advanced Analytics | Provides features like predictive analytics, statistical functions, and data mining capabilities, though potentially less extensive than Tableau. | Offers advanced analytics capabilities, including sophisticated statistical modeling and machine learning integrations. | Tableau’s advanced analytics are often considered more powerful, but Zoho Analytics provides sufficient functionality for many users. |
Data Integration Methods
Zoho Analytics supports a variety of data integration methods, ensuring seamless connectivity with diverse data sources. This flexibility is crucial for businesses that rely on multiple systems and applications. The platform allows for direct integration with popular cloud databases like MySQL, PostgreSQL, and Oracle, as well as spreadsheet applications such as Microsoft Excel and Google Sheets. Furthermore, Zoho Analytics offers pre-built connectors for popular CRM systems (like Zoho CRM, Salesforce) and other enterprise applications.
For more complex integrations, Zoho Analytics provides robust APIs, allowing for custom integrations with virtually any data source. This versatility ensures that data from various sources can be consolidated into a single platform for comprehensive analysis and reporting.
Data Import and Transformation

Getting your data into Zoho Analytics and prepping it for analysis is key. Think of it like getting your ingredients ready before you start cooking – you wouldn’t just throw everything in a pot raw, right? This section covers importing data from various sources and then cleaning it up so your analysis is accurate and insightful.Zoho Analytics offers a pretty straightforward process for importing data.
You can pull in data from a variety of places, including spreadsheets (like Excel or Google Sheets), databases (MySQL, PostgreSQL, and more), cloud storage (like Google Drive or Dropbox), and even directly from other Zoho apps. The import process usually involves selecting your data source, specifying the file or database connection details, and then choosing which sheets or tables to import.
Zoho Analytics handles a lot of the heavy lifting, automatically detecting data types and creating the necessary fields in your dataset.
Importing Data from Various Sources
This section details the specific steps for importing data. First, you’ll navigate to the “Import Data” option within Zoho Analytics. Then, you’ll select your data source (e.g., “Spreadsheet,” “Database,” “Cloud Storage”). Following this, you’ll provide the necessary credentials or file path to access your data. Finally, you’ll choose the specific sheets or tables you want to import and click “Import.” The system will then process your data and make it available for analysis.
For example, importing an Excel file of sales data would involve selecting the “Spreadsheet” option, uploading the Excel file, and then selecting the relevant sheet containing the sales figures. For a database, you would enter your database connection details (host, username, password, etc.) and choose the table containing the relevant information.
Data Cleaning and Transformation
Once your data is imported, it’s often necessary to clean and transform it. This might involve handling missing values, correcting inconsistencies, or creating new calculated fields. Zoho Analytics provides powerful tools for this.Let’s say you’re working with sales data that contains some missing values in the “Quantity Sold” column. You can use Zoho Analytics’ data transformation features to replace these missing values with zeros, the average quantity sold, or even remove the rows with missing data entirely.
This ensures your analysis isn’t skewed by incomplete data. Another common task is standardizing data formats. Perhaps your “Date” column has dates in different formats (MM/DD/YYYY, DD/MM/YYYY, etc.). Zoho Analytics allows you to convert all dates to a consistent format. You can also create calculated fields.
For instance, if you have columns for “Quantity Sold” and “Unit Price,” you could easily create a new column called “Total Revenue” by multiplying these two columns. These transformations are accomplished through Zoho Analytics’ built-in formula editor, which allows for a wide range of functions.
Step-by-Step Guide to Data Preparation
Effective data analysis begins with effective data preparation. Here’s a step-by-step guide:
- Import Data: Import your data from the chosen source, carefully selecting the relevant sheets or tables.
- Data Inspection: Thoroughly examine your imported data. Look for missing values, inconsistencies, or errors.
- Data Cleaning: Address missing values by replacing them with appropriate values (e.g., zeros, averages, or by removing rows) or handle inconsistencies by standardizing formats or correcting errors.
- Data Transformation: Create new calculated fields as needed using Zoho Analytics’ formula editor. For example, calculate percentages, ratios, or sums.
- Data Validation: After cleaning and transformation, double-check your data to ensure accuracy and consistency.
Following these steps will ensure your data is ready for accurate and insightful analysis within Zoho Analytics. Remember, clean data leads to better decisions.
Report Creation and Customization
Zoho Analytics offers a robust suite of tools for creating and customizing reports, allowing users to transform raw data into compelling visualizations that tell a story. The platform’s flexibility caters to various analytical needs, from simple summaries to complex interactive dashboards. Understanding the different report types and best practices is key to maximizing the platform’s potential and effectively communicating insights.
Zoho Analytics provides a wide array of report types, each designed to address specific analytical requirements. Users can choose the format best suited to their data and the message they wish to convey. Effective report design is crucial for clear communication and actionable insights.
Report Types Available in Zoho Analytics
Zoho Analytics supports several report types, including but not limited to: tabular reports (perfect for detailed data viewing), summary reports (ideal for high-level overviews), pivot tables (excellent for exploring relationships between multiple variables), charts (for visual representation of data trends), and dashboards (for combining multiple reports into a single, cohesive view). Choosing the right type depends heavily on the data and the intended audience.
For example, a sales team might prefer a chart visualizing sales trends over time, while a financial analyst might need a detailed tabular report showing individual transactions.
Examples of Effective Report Designs
Effective report design is about clarity and impact. Consider a sales report showing year-over-year growth. A simple bar chart comparing sales figures for each year would be highly effective. Another example could be a marketing campaign performance report. A pie chart illustrating the breakdown of leads from different channels (e.g., social media, email, paid advertising) provides a quick and easy-to-understand overview of campaign effectiveness.
For a more detailed analysis, a tabular report showing individual campaign metrics (clicks, conversions, cost-per-acquisition) would be necessary. A dashboard could then combine both the pie chart and tabular report, providing a comprehensive view of the campaign’s performance.
Best Practices for Creating Visually Appealing and Informative Reports
Creating effective reports involves more than just selecting the right chart type. Several best practices contribute to a report’s success:
Designing visually appealing and informative reports requires careful consideration of several factors. A well-designed report should be easy to understand, visually engaging, and effectively communicate key insights. The following best practices help achieve this.
- Use clear and concise titles and labels: Avoid jargon and ensure all elements are easily understandable.
- Choose appropriate chart types: Select the chart type that best represents the data and the message you want to convey. Don’t force a chart type that doesn’t fit the data.
- Use consistent formatting: Maintain a consistent style throughout the report to enhance readability and professionalism.
- Highlight key findings: Use visual cues such as color, size, and annotations to emphasize important data points.
- Keep it simple: Avoid cluttering the report with unnecessary details. Focus on presenting the most important information clearly and concisely.
- Use appropriate color palettes: Choose colors that are visually appealing and easy to distinguish. Avoid using too many colors, as this can make the report difficult to read.
- Test and iterate: Before finalizing the report, test it with your intended audience to ensure it’s easy to understand and meets their needs.
Dashboard Creation and Management

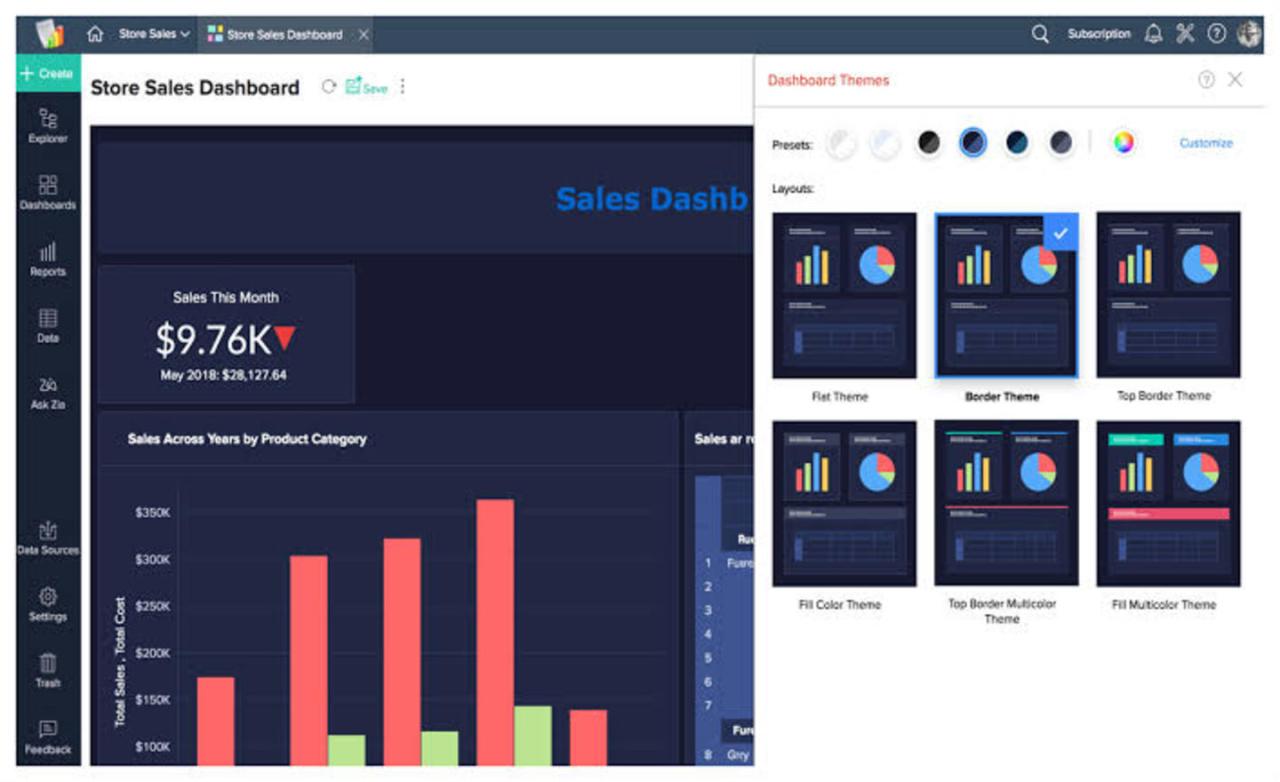
Building dashboards in Zoho Analytics is surprisingly intuitive, even for someone who’s not a data wiz. It lets you take all that cleaned-up data you’ve imported and transformed and present it in a visually compelling and easily digestible way. Think of it as the final, polished presentation of your data analysis.Zoho Analytics offers a drag-and-drop interface for building dashboards.
You can select widgets representing different visualizations (like charts, tables, maps, etc.) and place them onto a canvas. The process involves choosing data sources, defining the metrics to display, and customizing the appearance of each widget to match your branding or preferences. The real power comes in how easily you can connect widgets – clicking on one element in one chart can filter the data shown in another, creating interactive explorations.
Dashboard Layouts for Different Screen Sizes
Designing dashboards for different screen sizes is crucial for ensuring usability across various devices (laptops, tablets, phones). Zoho Analytics allows for responsive design, meaning your dashboards adapt to the screen size automatically. For instance, a dashboard designed for a large desktop monitor might display multiple charts side-by-side, providing a comprehensive overview. On a smaller mobile screen, the same dashboard might stack these charts vertically to maintain readability and avoid overwhelming the user.
Consider using larger font sizes and simpler layouts for mobile dashboards to improve legibility. A good example would be a sales dashboard: on a desktop, you could show regional sales breakdowns in a map alongside individual product performance charts. On a phone, these might be presented sequentially, starting with a summary of overall sales and then drilling down to regional details with a tap.
Sharing and Collaboration on Dashboards
Sharing and collaborating on dashboards is a key feature in Zoho Analytics. You can easily share dashboards with specific individuals or groups, granting them different permission levels (view-only, edit, etc.). This facilitates teamwork, allowing colleagues to review, analyze, and contribute to the insights derived from the data. Real-time collaboration is also possible, enabling multiple users to work on the same dashboard concurrently, adding comments, or making changes together.
This streamlined process fosters a more collaborative and efficient data-driven decision-making process. For example, a marketing team could share a campaign performance dashboard, allowing everyone to track progress and contribute insights in real-time. The built-in commenting features make it easy to discuss specific data points or trends without needing separate email chains or meetings.
Data Security and Access Control
Zoho Analytics prioritizes data security, employing robust measures to protect your sensitive information. Understanding these features and how to manage user access is crucial for maintaining data integrity and compliance. This section details the security features and best practices for securing your data within the platform.Zoho Analytics offers a multi-layered security approach encompassing data encryption both in transit and at rest, regular security audits, and adherence to industry best practices.
This ensures your data remains confidential and protected from unauthorized access. The platform also benefits from Zoho’s overall robust security infrastructure, leveraging their experience in securing a wide range of business applications.
User Roles and Permission Levels
Zoho Analytics provides granular control over data access through a system of user roles and permission levels. This allows administrators to precisely define what each user can see and do within the platform. These permissions are critical for maintaining data integrity and preventing accidental or malicious data modification.
- Administrator: Has full access to all features and data within the organization’s Zoho Analytics account. They can manage users, permissions, and all aspects of the platform.
- Editor: Can create, edit, and delete reports, dashboards, and data sources. Access to data is typically restricted to specific data sets or folders defined by the administrator.
- Viewer: Can only view reports and dashboards; they cannot make any changes to the data or the platform’s configuration. This role is ideal for users who need to access information but not modify it.
- Custom Roles: Administrators can create custom roles with specific permissions tailored to individual user needs. This allows for highly granular control over data access.
Data Access Management Best Practices
Implementing strong data access management practices is vital for maintaining data security. These practices should be regularly reviewed and updated to reflect changes in your organization’s needs and the evolving threat landscape.
- Principle of Least Privilege: Grant users only the minimum necessary permissions to perform their job functions. Avoid granting excessive access that could increase the risk of data breaches.
- Regular Permission Reviews: Periodically review and update user permissions to ensure they are still appropriate. Remove access for users who no longer require it or whose roles have changed.
- Strong Passwords and Multi-Factor Authentication (MFA): Enforce strong password policies and enable MFA to add an extra layer of security to user accounts. This significantly reduces the risk of unauthorized access.
- Data Encryption: Utilize Zoho Analytics’ built-in encryption features to protect data both in transit and at rest. This ensures data confidentiality even if a breach occurs.
- Regular Security Audits: Conduct regular security audits to identify and address any potential vulnerabilities in your Zoho Analytics setup. This proactive approach helps to maintain a secure environment.
Integration with Other Zoho Applications: Zoho Analytics
Zoho Analytics isn’t a standalone tool; it’s a powerful component within the broader Zoho ecosystem. This deep integration with other Zoho applications significantly enhances its utility and streamlines various business processes, making it a truly valuable asset for businesses already invested in the Zoho suite. The seamless data flow and interconnected functionality eliminate the need for manual data transfers and reconciliation, saving time and reducing errors.Zoho Analytics leverages the data residing within other Zoho applications to provide a comprehensive, unified view of your business operations.
This interconnectedness allows for a more holistic understanding of your data, leading to better informed decisions and improved business outcomes. Imagine having your CRM data, project management data, and marketing campaign data all effortlessly analyzed within a single platform – that’s the power of Zoho Analytics’ integration.
Data Integration with Zoho CRM
Zoho CRM stores a wealth of customer interaction data, from contact details to sales history. Zoho Analytics seamlessly integrates with Zoho CRM, allowing users to directly pull this data into Analytics for detailed analysis. This allows businesses to create insightful reports on sales performance, customer segmentation, and marketing campaign effectiveness. For example, a sales manager can easily analyze sales data from Zoho CRM within Zoho Analytics to identify top-performing products, understand customer demographics that are most responsive to specific campaigns, and predict future sales trends.
This integrated approach offers a far more efficient method for understanding customer behavior and optimizing sales strategies than relying on separate, disparate systems.
Collaboration with Zoho Creator
Zoho Creator allows users to build custom applications tailored to their specific business needs. Integrating Zoho Analytics with Zoho Creator empowers users to analyze the data generated by these custom applications. This opens up possibilities for analyzing data from unique business processes that aren’t covered by standard Zoho applications. For instance, a company using a custom Zoho Creator application to track inventory levels can use Zoho Analytics to monitor stock levels, identify potential shortages, and optimize inventory management strategies.
This real-time analysis ensures efficient resource allocation and minimizes stock-outs or overstocking.
Benefits of the Zoho Ecosystem Integration
The benefits of using Zoho Analytics within the Zoho ecosystem are multifaceted. The primary advantage is the ease of data access and analysis. The streamlined integration eliminates the need for manual data extraction, cleaning, and loading, saving considerable time and effort. Moreover, the unified view of data across different Zoho applications allows for a more holistic understanding of business performance, leading to better decision-making.
This integrated approach fosters improved collaboration between different departments, as everyone works with the same data source and analytical tools. Finally, the reduced data silos lead to a more efficient and effective workflow, optimizing overall business operations.
Pricing and Plans
So, you’re ready to dive into Zoho Analytics but need to figure out which plan fits your needs and budget? Let’s break down the pricing and features to help you make the best choice. Zoho offers a range of plans, each designed to cater to different user needs and data volumes. Understanding these options is key to getting the most out of your Zoho Analytics experience.
Zoho Analytics is a powerful tool for data visualization and reporting, offering a flexible alternative to other platforms. If you’re already invested in the Microsoft Office suite, you might be wondering how it compares to microsoft office 2019 ‘s built-in tools. Ultimately, the best choice depends on your specific needs, but Zoho Analytics often provides more advanced analytical capabilities than what you’ll find in standard spreadsheet software.
Zoho Analytics offers a tiered pricing structure, meaning that the cost increases with the number of users and the amount of data you can store and process. Generally, more users and higher data storage capacities mean higher costs. However, Zoho also offers a free plan, ideal for individuals or small teams needing basic analytics capabilities. Choosing the right plan involves carefully considering your team size, data volume, and the level of features you require.
Zoho Analytics Pricing Plans
The following table summarizes the key features and pricing of Zoho Analytics plans. Note that pricing can change, so it’s always best to check the official Zoho website for the most up-to-date information. The plans are designed to scale with your needs, allowing you to upgrade or downgrade as your requirements evolve.
| Plan Name | Number of Users | Data Storage | Price (USD/Month) |
|---|---|---|---|
| Free | 1 | 5 GB | $0 |
| Basic | 5 | 25 GB | $25 |
| Premium | 10 | 100 GB | $50 |
| Enterprise | Customizable | Customizable | Contact Sales |
Feature Comparison Across Plans
The primary differences between Zoho Analytics plans lie in the number of users allowed, the amount of data storage available, and the advanced features included. For instance, the free plan offers basic reporting and dashboarding capabilities, while higher-tier plans unlock features like embedded analytics, advanced visualizations, and more robust data integration options. The Enterprise plan is highly customizable, allowing organizations to tailor their plan to their specific needs.
Factors to Consider When Choosing a Plan
Selecting the right Zoho Analytics plan requires careful consideration of several key factors. These factors will help ensure that the chosen plan meets your current and future analytical needs without overspending.
- Team Size: The number of users who need access to Zoho Analytics directly impacts the plan you choose. Larger teams require plans with a higher user capacity.
- Data Volume: The amount of data you need to store and analyze is crucial. Higher data volumes necessitate plans with greater storage capacity.
- Required Features: Evaluate which features are essential for your analysis. Do you need advanced visualizations, embedded analytics, or specific integrations? Higher-tier plans often offer more advanced functionalities.
- Budget: Balance your needs with your budget. Zoho Analytics offers a range of plans to accommodate various budgets, allowing you to find a balance between cost and functionality.
- Scalability: Consider your future data growth and potential team expansion. Choose a plan that can easily scale to accommodate future needs, avoiding the need for frequent upgrades.
Zoho Analytics Use Cases
Zoho Analytics boasts impressive capabilities, but its true power lies in its application. Seeing how different businesses leverage its features to solve real-world problems provides a much clearer picture of its value. The following case studies illustrate how Zoho Analytics has helped organizations across various sectors improve decision-making and achieve significant business outcomes.
Case Study 1: Boosting Sales Performance at a Retail Chain, Zoho analytics
This national retail chain faced challenges in analyzing sales data spread across numerous stores and product categories. Their legacy system provided limited analytical capabilities, making it difficult to identify trends, pinpoint underperforming products, and optimize inventory management. Zoho Analytics provided the solution. By importing sales data from their point-of-sale (POS) systems and integrating it with other relevant data sources like marketing campaigns and customer demographics, they created a comprehensive view of their business performance.The solution involved creating interactive dashboards displaying key performance indicators (KPIs) such as sales revenue, average transaction value, and customer conversion rates, segmented by store location, product category, and promotional period.
This allowed regional managers to quickly identify underperforming stores or products and take corrective actions. They also used Zoho Analytics’ predictive analytics capabilities to forecast future sales based on historical data and seasonal trends.The visual representation of the data analysis process would be a dashboard showing several interconnected charts. A geographical map would highlight sales performance by region, with color-coding indicating high and low performing areas.
A bar chart would compare sales figures across different product categories, while a line chart would display sales trends over time. A pie chart would show the breakdown of sales by customer segment. These charts are all linked dynamically, so clicking on a region on the map would automatically filter the other charts to show data for that specific region, providing a drill-down analysis capability.
Case Study 2: Enhancing Customer Service at a Telecom Provider
A large telecom provider struggled with managing a high volume of customer service inquiries and resolving issues efficiently. They lacked a centralized system to track customer interactions, analyze service requests, and identify common problems. Zoho Analytics helped them consolidate and analyze data from multiple sources, including call center logs, customer support tickets, and social media feedback.The solution involved creating custom reports and dashboards to track key metrics like average handling time, customer satisfaction scores (CSAT), and the frequency of specific issues.
Zoho Analytics allowed them to identify recurring problems and prioritize solutions. For example, they discovered a surge in complaints related to a specific mobile app feature, allowing them to quickly address the issue and improve customer satisfaction.The visual representation would consist of a dashboard with several charts. A funnel chart would visualize the customer journey, showing the percentage of customers who progressed through each stage of the support process.
A bar chart would display the top reasons for customer contact, allowing for prioritization of issue resolution. A line chart would illustrate CSAT scores over time, showcasing the impact of implemented improvements. A heatmap could show the geographical distribution of customer complaints, allowing for region-specific solutions.
Case Study 3: Optimizing Supply Chain Management for a Manufacturing Company
A manufacturing company experienced difficulties in optimizing its supply chain due to inefficient inventory management and unreliable forecasting. They relied on disparate spreadsheets and manual processes, leading to stockouts, excess inventory, and increased costs. Zoho Analytics provided a centralized platform to consolidate and analyze data from various sources, including production schedules, inventory levels, and supplier performance.The solution involved creating dashboards that provided real-time visibility into inventory levels, production schedules, and supplier lead times.
Zoho Analytics’ predictive analytics helped forecast demand and optimize inventory levels, reducing stockouts and minimizing waste. The company could also track supplier performance, identifying reliable and unreliable suppliers and adjusting their sourcing strategies accordingly.The visual representation would feature a dashboard showing several linked charts. A stock level chart would display inventory levels for each product, with color-coding to highlight low stock items.
A Gantt chart would illustrate the production schedule, showing planned and actual completion dates. A scatter plot would analyze the relationship between production volume and supplier lead times, identifying potential bottlenecks. A KPI dashboard would show key metrics such as inventory turnover rate, order fulfillment rate, and supplier on-time delivery rate.
Troubleshooting and Support
Okay, so you’re diving into Zoho Analytics and things aren’t quite going as planned? Don’t worry, it happens to the best of us. This section covers some common hiccups and how to smooth them out. We’ll walk through some troubleshooting steps and point you towards the resources Zoho provides to get you back on track.
Zoho Analytics, while powerful, can sometimes present challenges. Understanding common issues and their solutions can significantly improve your overall experience and save you valuable time. This section provides a practical guide to navigating those challenges effectively.
Data Import Errors
Data import failures are a frequent frustration. These often stem from issues with file formatting, incorrect data types, or exceeding data limits. Solutions include carefully checking your file for inconsistencies, ensuring your data types match the expected Zoho Analytics fields, and potentially breaking down large files into smaller, more manageable chunks for upload. Remember to review Zoho’s documentation on supported file formats and data limits.
Report Rendering Problems
Sometimes, reports might fail to render correctly, displaying errors or incomplete data. This could be due to complex queries, data inconsistencies, or browser issues. Troubleshooting involves simplifying your queries, verifying your data integrity, clearing your browser cache and cookies, and trying a different browser. If the problem persists, checking Zoho’s system status page for any outages can also be helpful.
Dashboard Display Issues
Dashboard problems can range from widgets not loading to incorrect data visualization. This often arises from issues with widget configurations, underlying data sources, or browser compatibility. Solutions include reviewing widget settings, verifying the data source connection, and ensuring your browser is up-to-date and compatible with Zoho Analytics.
Permission and Access Control Problems
Sharing reports and dashboards can sometimes lead to access issues. Users might lack the necessary permissions to view or edit content. Troubleshooting requires carefully reviewing the permission settings for each user and ensuring they have the appropriate roles and access levels assigned to them. Zoho Analytics’ detailed permission management system needs to be thoroughly understood.
Technical Support Resources
Zoho offers a comprehensive suite of support resources. Their online help center boasts extensive documentation, FAQs, and tutorials. They also have a dedicated support team reachable via email and phone, offering personalized assistance for complex issues. The Zoho community forums provide a platform to connect with other users, share solutions, and find answers to common questions. Proactive use of these resources can greatly enhance your problem-solving capabilities.
Future Trends and Developments
Zoho Analytics, already a robust platform, has significant potential for future growth and improvement. Its evolution will likely be shaped by emerging trends in data analytics, focusing on enhancing user experience, expanding capabilities, and improving integration with other technologies. This will allow businesses to leverage data more effectively and gain a competitive edge.Zoho Analytics’ future trajectory hinges on several key areas.
We can expect to see advancements that streamline data analysis, making it more accessible to a wider range of users, regardless of their technical expertise. Simultaneously, the platform will likely embrace more sophisticated analytical techniques to meet the increasing demand for in-depth insights.
Enhanced AI and Machine Learning Integration
Zoho Analytics is likely to integrate more advanced AI and machine learning capabilities. This could involve automated data cleaning and preparation, predictive analytics features, and intelligent insights generation. Imagine a scenario where the system automatically identifies outliers in your sales data and suggests potential causes, saving analysts significant time and effort. This level of automation will make data-driven decision-making more efficient and accessible to non-technical users.
The increased accuracy and speed of insights derived from AI and ML will enable businesses to respond more quickly to market changes and optimize operations in real-time. For example, a retail company could use these features to predict future demand for products, optimizing inventory management and minimizing waste.
Improved Data Visualization and Storytelling
The future of data visualization within Zoho Analytics likely involves more interactive and engaging dashboards. We might see the introduction of advanced charting options, dynamic data updates, and improved customization features. The focus will shift toward creating compelling data narratives, transforming complex datasets into easily understandable stories. This would empower businesses to communicate data-driven insights more effectively to both technical and non-technical stakeholders, improving collaboration and decision-making across departments.
For instance, a marketing team could use these features to create visually appealing reports demonstrating the success of their campaigns, easily conveying their impact on key metrics.
Advanced Data Security and Compliance
With increasing concerns about data privacy and security, Zoho Analytics will likely strengthen its security features. This could involve enhanced encryption methods, improved access controls, and better compliance with various data privacy regulations (like GDPR and CCPA). Businesses will benefit from increased confidence in the security of their sensitive data, reducing the risk of breaches and ensuring compliance with regulatory requirements.
This is crucial for maintaining trust with customers and partners, and avoiding potentially significant financial penalties. For example, a financial institution using Zoho Analytics will need to know that their client data is protected by the highest security standards.
Expanded Integrations and Ecosystem
We can expect Zoho Analytics to expand its integrations with other business applications and platforms. This could include deeper integrations with other Zoho products, as well as third-party applications. This would create a more seamless data flow across different systems, enabling businesses to access and analyze data from various sources in a unified environment. This enhanced interoperability will simplify data management and analysis, leading to a more holistic understanding of business performance.
For instance, integrating with CRM systems will allow for a more complete view of customer interactions and behavior, enabling more effective targeted marketing campaigns.
Closing Summary
Ultimately, Zoho Analytics empowers businesses of all sizes to make data-driven decisions. Its intuitive interface, robust features, and affordable pricing make it a compelling option for anyone looking to harness the power of their data. From streamlined reporting to interactive dashboards, Zoho Analytics simplifies the complexities of data analysis, allowing you to focus on what truly matters: gaining valuable insights and achieving your business goals.
So, dive in, explore its capabilities, and unleash the potential hidden within your data.
FAQ Guide
Is Zoho Analytics only for tech-savvy users?
Nope! It’s designed to be user-friendly, even for those with limited technical experience. The interface is intuitive, and there are plenty of resources available to help you get started.
Can I integrate Zoho Analytics with non-Zoho applications?
Yes! While Zoho’s ecosystem integration is a major strength, Zoho Analytics also supports connections to various third-party apps and databases through APIs and connectors. Check their documentation for compatible options.
What kind of customer support does Zoho Analytics offer?
They offer a range of support options, including online documentation, a knowledge base, and community forums. Depending on your plan, you may also have access to dedicated customer support representatives.
How much does Zoho Analytics cost?
Pricing varies depending on the features and storage you need. They offer several plans, ranging from free options with limited capabilities to enterprise-level plans with advanced features. Check their website for the most up-to-date pricing information.
What are the limitations of the free plan?
The free plan usually comes with restrictions on data storage, the number of users, and the advanced features available. It’s great for getting started, but for serious data analysis, a paid plan is recommended.