PSPP, a free and open-source statistical package, is basically SPSS’s cooler, more affordable cousin. It boasts a surprisingly robust set of features, making it a solid choice for students, researchers, and anyone needing to crunch numbers without breaking the bank. Think of it as the underdog that consistently delivers impressive results, offering a powerful alternative to pricey commercial software.
Table of Contents
This guide will walk you through PSPP’s core functionalities, from importing data and performing basic manipulations to diving into descriptive and inferential statistics. We’ll cover everything from creating compelling charts and tables to troubleshooting common issues. Get ready to unlock the power of data analysis – without the hefty price tag!
PSPP Introduction
PSPP is a free, open-source program for statistical analysis. Think of it as a powerful, yet user-friendly alternative to SPSS, offering a wide range of statistical capabilities without the hefty price tag. It’s a great tool for students, researchers, and anyone needing to perform statistical analysis on their data.PSPP’s core functionality revolves around data manipulation and statistical analysis.
It allows users to import data from various formats, clean and prepare data for analysis, and then perform a broad spectrum of statistical tests. This includes descriptive statistics (like means, standard deviations, and frequencies), inferential statistics (such as t-tests, ANOVA, and regression analysis), and more advanced techniques. Its capabilities extend to creating visually informative graphs and charts to help users understand and present their findings effectively.
PSPP Development History
PSPP’s development began as an open-source alternative to SPSS. Driven by a need for a free and accessible statistical package, developers aimed to create a program that replicated SPSS’s functionality while remaining completely open-source. This collaborative effort involved contributions from numerous programmers and statisticians around the world. Over time, PSPP has undergone significant improvements and enhancements, expanding its capabilities and improving its user interface.
The project continues to evolve, with regular updates addressing bug fixes and adding new features based on user feedback and advancements in statistical methodology. Its open-source nature allows for transparency and community-driven development, ensuring its ongoing improvement and accessibility.
PSPP vs. SPSS

PSPP and SPSS are both statistical software packages used for data analysis, but they differ significantly in their pricing, features, and user experience. While both can handle a wide range of statistical procedures, their target audiences and capabilities vary considerably. This comparison highlights the key distinctions between these two popular programs.PSPP offers a strong set of features for many common statistical analyses, including descriptive statistics, t-tests, ANOVA, correlation, and regression.
It’s a powerful tool for students and researchers on a budget, mirroring much of SPSS’s functionality. However, SPSS boasts a far more extensive feature set, including advanced statistical modeling techniques not found in PSPP. This broader scope allows for more complex analyses and specialized applications.
Feature Comparison
The core functionality of PSPP and SPSS overlaps substantially. Both programs allow users to import, clean, manage, and analyze data. They both offer a wide array of statistical tests and procedures. However, SPSS includes many advanced techniques such as complex mixed-model ANOVA, structural equation modeling, and specialized procedures for specific research areas (e.g., psychometrics). PSPP’s feature set is more focused on common statistical methods, offering a simpler, more streamlined experience for users who don’t need the advanced capabilities of SPSS.
For instance, while both can perform regression analysis, SPSS provides a much wider range of regression models and diagnostic tools.
User Interface Differences
The user interfaces of PSPP and SPSS differ noticeably. PSPP maintains a more minimalist and straightforward interface, closely resembling the classic SPSS interface from older versions. This can be advantageous for users who prefer a less cluttered workspace and find simpler navigation more intuitive. In contrast, SPSS’s interface, especially in more recent versions, is more modern and visually rich but can feel overwhelming to new users due to its extensive features and options.
The menu structures and dialog boxes also differ, with SPSS offering more options and sometimes more complex navigation. This difference in interface design impacts the learning curve; PSPP generally has a gentler learning curve, while mastering SPSS’s interface takes more time and effort.
Advantages and Disadvantages
| Feature | PSPP Advantages | PSPP Disadvantages | SPSS Advantages | SPSS Disadvantages |
|---|---|---|---|---|
| Cost | Free and open-source | None significant | Powerful and versatile | Expensive; licensing costs can be prohibitive |
| Features | Sufficient for many common statistical analyses | Lacks advanced statistical techniques found in SPSS | Extensive feature set for advanced analyses | Can be overwhelming for beginners due to its complexity |
| User Interface | Simple and intuitive; easier learning curve | Less visually appealing than SPSS | Modern and visually rich (though can be overwhelming) | Steeper learning curve; can be complex to navigate |
| Platform Compatibility | Cross-platform compatibility (Windows, macOS, Linux) | None significant | Cross-platform compatibility (Windows, macOS) | None significant |
| Community Support | Active community providing support and resources | Smaller community compared to SPSS | Large and well-established community | None significant |
PSPP Data Import and Export

Getting your data into and out of PSPP is a crucial part of the process. Luckily, PSPP handles a variety of common file formats, making it pretty straightforward to work with data from different sources. This section will cover the most common import and export methods, along with some tips for dealing with different data types.PSPP offers several ways to import and export data, ensuring compatibility with many popular data formats.
Understanding these methods will allow for seamless data transfer between PSPP and other applications, maximizing the efficiency of your data analysis workflow.
Importing Data into PSPP
PSPP supports importing data from various file formats, including CSV (Comma Separated Values), SPSS (.sav), and Excel (.xls, .xlsx). The process is generally intuitive, but understanding the nuances of each format can prevent potential errors.
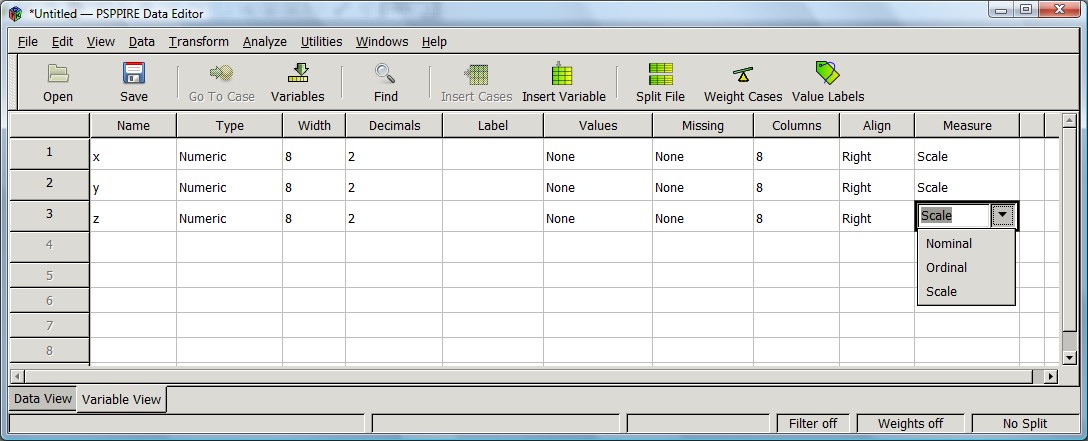
- CSV Import: CSV files are a simple and widely used format. PSPP’s import function automatically detects commas as delimiters, but you can specify other delimiters (like tabs or semicolons) if needed. During import, ensure your data types are correctly interpreted. For example, if a column contains numbers representing categorical data (like 1=Male, 2=Female), PSPP might initially treat it as a numeric variable.
You might need to manually recode it as a nominal variable after importing. This can be done through the “Variable View” in PSPP.
- SPSS (.sav) Import: Importing SPSS files is straightforward. PSPP handles the transfer of variable names, labels, and data types seamlessly. However, if the SPSS file contains complex syntax or macros, those elements might not be fully transferred. It’s always good to check the imported data for accuracy.
- Excel (.xls, .xlsx) Import: Excel files can be imported, but PSPP generally works best with data organized in a single sheet. If your data spans multiple sheets, consider consolidating it into one sheet before importing. PSPP will attempt to automatically detect data types, but you should always review the imported data to ensure accuracy, especially for dates and mixed data types within a single column.
Exporting Data from PSPP
Exporting data from PSPP is equally important, allowing you to share your results or use them in other software. Similar to importing, PSPP offers flexibility in choosing the output format.
- CSV Export: Exporting to CSV is a common practice due to its simplicity and broad compatibility. PSPP will generate a comma-separated file containing your data, making it easily readable by spreadsheets and other statistical packages. You can choose whether to include variable labels in the exported file.
- SPSS (.sav) Export: PSPP can export data in the SPSS (.sav) format, allowing seamless transfer to SPSS. Variable labels and value labels will be included in the exported file, preserving the integrity of your data and metadata.
- Excel (.csv) Export: While not a direct .xls or .xlsx export, exporting to CSV allows for easy opening in Excel. This is often the preferred method due to potential compatibility issues with the native Excel formats.
Handling Different Data Types During Import/Export
Data types (numeric, string, date) are critical. Inconsistencies can lead to errors. Before importing, ensure your data is clean and consistently formatted. For example, dates should follow a consistent format (e.g., YYYY-MM-DD). During import, review how PSPP interprets each column.
If it misinterprets a column, you may need to manually change its data type in PSPP’s variable view. Similarly, during export, review the exported file to ensure that data types are preserved correctly. For example, exporting a variable with value labels will ensure that the labels are included in the exported file, preserving the context of the data.
PSPP’s a solid free alternative to SPSS, great for crunching data for your psych or sociology class. But if you need to write up your findings in a polished report, you’ll probably want a word processor; you can snag a copy via a microsoft word free download for windows 10 if you don’t already have one. Then, once your paper’s formatted, you can get back to analyzing your PSPP results.
Basic Data Manipulation in PSPP
PSPP, despite its free and open-source nature, offers a robust set of tools for data manipulation, essential for preparing your data for analysis. This section will cover cleaning your data, transforming variables, and selecting subsets for focused analysis. These are crucial steps in any statistical project, ensuring your results are accurate and meaningful.
Data Cleaning: Handling Missing Values
Missing data is a common problem in datasets. PSPP provides several ways to address this. The simplest approach is to identify and remove cases (rows) with missing values. However, this can lead to a loss of valuable data, especially if the missingness is not random. A more sophisticated method involves imputation, replacing missing values with estimated ones.
PSPP allows you to replace missing values with the mean, median, or a specific constant for numerical variables. For categorical variables, you might replace missing values with the mode or a new category representing “missing.” The choice of imputation method depends on the nature of your data and the pattern of missingness. For example, if you have a small number of missing values scattered randomly, mean imputation might be acceptable.
However, if you have systematic missingness, a more complex imputation technique may be necessary. Careful consideration should be given to the potential bias introduced by imputation.
Variable Transformation: Recoding and Creating New Variables
Often, your raw data isn’t in the ideal format for analysis. Recoding allows you to change the values of existing variables. For instance, you might recode a numerical variable into categories (e.g., age into age groups). This is typically done using the `RECODE` command. You can also create entirely new variables based on existing ones.
This might involve simple arithmetic operations (e.g., creating a body mass index variable from height and weight), or more complex transformations using functions like logarithms or square roots. For example, you might create a new variable representing the difference between two existing variables or a calculated score based on a formula. The `COMPUTE` command is your friend here.
For instance, `COMPUTE BMI = weight/((height/100)2);` would calculate BMI from weight (in kg) and height (in cm).
Data Subset Selection
Analyzing the entire dataset isn’t always necessary or efficient. PSPP allows you to select subsets of your data based on specific criteria. This is particularly useful when you want to analyze a specific group within your sample or when you need to focus on a particular aspect of your data. This is usually accomplished using the `SELECT IF` command, allowing you to specify conditions based on variable values.
For example, `SELECT IF age > 65;` would select only cases where the age is greater than 65. This allows for focused analysis on specific populations or conditions within your dataset, increasing the efficiency and relevance of your analysis.
Descriptive Statistics in PSPP
PSPP, the free open-source alternative to SPSS, offers a robust suite of tools for conducting descriptive statistical analysis. This is crucial for understanding the basic characteristics of your data before diving into more complex analyses. We’ll cover how to calculate key descriptive statistics, create useful visualizations, and summarize your data effectively using PSPP’s features.
Calculating Descriptive Statistics
PSPP makes it easy to obtain common descriptive statistics like mean, median, standard deviation, and more. To do this, you’ll typically use the “Analyze” menu, then select “Descriptive Statistics,” and finally “Descriptives.” A dialog box will appear where you can select the variables you want to analyze. Let’s say you have a dataset with a variable representing student exam scores.
After selecting this variable, you can choose which statistics to compute (mean, median, standard deviation, variance, minimum, maximum, range, and more). PSPP will then output a table displaying these values, providing a quick summary of the central tendency and dispersion of your exam scores. For example, you might find a mean score of 78, a median of 80, and a standard deviation of 10, indicating a somewhat normally distributed dataset with some variability.
Creating Frequency Tables and Histograms
Understanding the distribution of your data is essential. Frequency tables and histograms are excellent tools for visualizing this. In PSPP, you can generate these using the “Analyze” menu, then selecting “Descriptive Statistics,” and finally “Frequencies.” Again, select the variable of interest (e.g., student exam scores). The output will include a frequency table showing the number of students who achieved each score, and you can also choose to generate a histogram, which visually represents the frequency distribution as bars.
A histogram will show you the shape of your data’s distribution – is it normally distributed, skewed, or bimodal? This visual representation is incredibly helpful for identifying patterns and potential outliers in your data. For instance, a histogram might reveal a cluster of high scores, suggesting a group of high-achieving students.
Summarizing Data Using Different Descriptive Measures
Different descriptive measures offer different insights into your data. The mean provides the average value, while the median represents the middle value when data is ordered. The standard deviation quantifies the spread or variability of the data around the mean. The range provides the difference between the maximum and minimum values, offering a broad perspective on data spread.
Selecting the appropriate descriptive measure depends on the nature of your data and the research question. For instance, if your data is heavily skewed (meaning it has a long tail on one side), the median might be a more appropriate measure of central tendency than the mean, as the mean can be heavily influenced by extreme values. Using multiple descriptive measures together gives a more complete picture of your data than relying on just one.
For example, a dataset with a high standard deviation suggests greater variability in the data than one with a low standard deviation, even if both datasets have the same mean.
Inferential Statistics in PSPP

PSPP, like SPSS, allows you to move beyond simply describing your data to making inferences about larger populations. Inferential statistics help us test hypotheses and draw conclusions about the relationships between variables, going beyond the simple summaries provided by descriptive statistics. This section will cover some key inferential statistical tests available in PSPP.
T-tests in PSPP
T-tests are used to compare the means of two groups. PSPP offers independent samples t-tests (comparing means of two independent groups) and paired samples t-tests (comparing means of the same group at two different times or under two different conditions). To perform a t-test, you’ll navigate to the “Analyze” menu, then select “Compare Means,” and finally choose either “Independent-Samples T Test” or “Paired-Samples T Test” depending on your research design.
You’ll then specify the dependent variable (the variable you’re measuring) and the grouping variable (the variable that defines the two groups). PSPP will output a table containing the t-statistic, degrees of freedom, and the p-value, which you’ll use to determine if there’s a statistically significant difference between the group means. For example, a researcher might use an independent samples t-test to compare the average test scores of students who received a new teaching method versus those who received the traditional method.
A paired samples t-test could be used to compare the average weight of participants before and after a weight-loss program.
ANOVA Tests in PSPP
Analysis of Variance (ANOVA) extends the t-test to situations where you have more than two groups. A one-way ANOVA compares the means of multiple groups based on a single independent variable. A two-way ANOVA extends this to examine the effects of two or more independent variables and their interactions. In PSPP, you access ANOVA through the “Analyze” menu, selecting “Compare Means,” and then choosing “One-Way ANOVA” or using the “General Linear Model” for more complex designs like two-way ANOVA.
Similar to the t-test, the output will include an F-statistic, degrees of freedom, and a p-value to assess the significance of differences between group means. For example, a researcher might use a one-way ANOVA to compare the average plant growth under three different fertilizer treatments. A two-way ANOVA could be used to examine the effects of both fertilizer type and watering frequency on plant growth.
Correlation Analysis in PSPP
Correlation analysis helps determine the strength and direction of the linear relationship between two continuous variables. A positive correlation indicates that as one variable increases, the other tends to increase as well. A negative correlation indicates that as one variable increases, the other tends to decrease. In PSPP, correlation analysis is performed by going to the “Analyze” menu, selecting “Correlate,” and then “Bivariate.” You’ll select the variables you want to analyze, and PSPP will provide a correlation matrix showing the Pearson correlation coefficient (r) and the associated p-value for each pair of variables.
The correlation coefficient ranges from -1 (perfect negative correlation) to +1 (perfect positive correlation), with 0 indicating no linear relationship. For instance, a researcher might use correlation analysis to examine the relationship between hours of study and exam scores. A strong positive correlation would suggest that more study time is associated with higher exam scores.
Creating Tables and Charts in PSPP
PSPP, while not as visually flashy as some commercial statistical packages, offers robust tools for creating tables and charts to effectively visualize your data. Understanding how to generate and customize these outputs is crucial for presenting your findings clearly and concisely. This section will guide you through the process of creating tables and charts in PSPP, highlighting key features and customization options.
Creating Tables in PSPP
PSPP doesn’t have a dedicated “table creation” module in the same way some other software does. Instead, tables are generated as output from various statistical procedures. For instance, running descriptive statistics will produce a table summarizing the mean, standard deviation, and other relevant metrics for your variables. You can then copy and paste this output into a word processor or spreadsheet program for further formatting and refinement.
More complex tables requiring specific arrangements might need manual creation in a separate application.
Sample Descriptive Statistics Table
The following table demonstrates a sample output you might obtain after running descriptive statistics on a dataset in PSPP. Note that the exact appearance may vary slightly depending on your PSPP version and the specific variables analyzed.
| Variable | N | Mean | Std. Deviation |
|---|---|---|---|
| Age | 100 | 35.2 | 8.7 |
| Income | 100 | 62500 | 15000 |
| Years of Education | 100 | 14.5 | 2.1 |
Generating Bar Charts and Scatter Plots, Pspp
Creating visualizations in PSPP involves using the “Graphs” menu. For bar charts, you’ll typically select the “Bar chart” option. You’ll then specify the variable to be displayed on the X-axis (usually a categorical variable) and the variable for the Y-axis (representing the frequency or some other quantitative measure). For scatter plots, choose the “Scatter plot” option, selecting the two variables you want to plot against each other (both should be continuous).
PSPP will then generate the chart, which you can save as an image file.
Chart and Table Customization Options
While PSPP’s customization options are more limited than some commercial software, you can still make adjustments to your charts and tables. For instance, you can often change chart titles, axis labels, and legends. The level of control depends on the specific chart type. For tables, the primary customization occurs after exporting the data to a spreadsheet or word processor, where you have far greater flexibility in formatting.
You can adjust font sizes, add borders, and change cell colors to enhance readability and visual appeal. Remember to always clearly label axes and provide a descriptive title for your charts and tables.
Advanced PSPP Features
PSPP, while user-friendly for basic statistical analysis, also packs a punch when it comes to more advanced techniques. This section explores some of these capabilities, focusing on regression analysis and custom scripting, allowing you to leverage PSPP’s power for more complex research questions. We’ll delve into the practical applications and demonstrate how these features can significantly enhance your data analysis workflow.
Regression Analysis in PSPP
Regression analysis is a powerful statistical method used to model the relationship between a dependent variable and one or more independent variables. In PSPP, this is accomplished using the “Regression” option within the “Analyze” menu. You’ll specify your dependent variable and then select the independent variables you wish to include in your model. The output will provide various statistics, including regression coefficients, R-squared, and p-values, allowing you to assess the significance and strength of the relationships between variables.
For example, you could use regression to model the relationship between house prices (dependent variable) and factors like square footage, number of bedrooms, and location (independent variables). The resulting model could then be used to predict house prices based on these factors. PSPP provides both linear and multiple regression capabilities, allowing for the analysis of complex relationships. Understanding the assumptions of regression analysis, such as linearity and homoscedasticity, is crucial for accurate interpretation of the results.
Creating Custom Scripts or Macros for PSPP
PSPP supports the creation of custom scripts or macros using its built-in scripting language, which allows for automation of repetitive tasks and the creation of custom analysis procedures. These scripts are written in a syntax similar to other statistical software packages and can be used to perform a wide range of functions, from data manipulation and transformation to running complex statistical analyses.
This offers considerable flexibility and allows users to tailor PSPP to their specific research needs. For instance, a macro could be written to automatically clean and prepare data for analysis, or to perform a series of statistical tests and generate a customized report. The learning curve might be steeper than using the graphical user interface, but the potential for efficiency gains is significant.
While PSPP’s documentation on scripting might be less extensive than some commercial packages, online resources and communities can provide valuable support and examples. A simple example might be a script to automatically calculate and output descriptive statistics for a specific set of variables within a dataset.
PSPP for Specific Applications
PSPP, despite being a free and open-source alternative, possesses the statistical power to tackle a wide array of analytical challenges across diverse fields. Its user-friendly interface and comprehensive feature set make it a viable option for both students and professionals, offering a cost-effective solution without compromising on functionality. This section will explore some key application areas where PSPP shines.PSPP’s capabilities extend far beyond simple data analysis; it’s a robust tool adaptable to the specific needs of various disciplines.
The following sections detail its use in social science research, business analytics, and other fields.
PSPP in Social Science Research
Social scientists frequently rely on statistical software to analyze survey data, experimental results, and other quantitative information. PSPP excels in these areas, offering a range of tools for descriptive statistics (like calculating means, medians, and standard deviations), inferential statistics (such as t-tests, ANOVA, and regression analysis), and data visualization. For example, a researcher studying voting patterns could use PSPP to analyze survey data, identifying correlations between demographic factors and voting preferences.
They could then use PSPP’s graphing capabilities to visually represent these findings, making them easier to understand and communicate. Another example would be analyzing the impact of a social program on a specific community by comparing pre- and post-intervention data using PSPP’s statistical tests.
PSPP’s Application in Business Analytics
In the business world, data-driven decision-making is paramount. PSPP provides a powerful, yet accessible, platform for business analytics. Businesses can use PSPP to analyze sales data, identify market trends, and forecast future performance. For instance, a marketing team could use PSPP to analyze customer demographics and purchasing behavior to tailor marketing campaigns more effectively. A financial analyst could employ PSPP to analyze stock market data, identifying patterns and trends to inform investment strategies.
The ability to perform regression analysis allows businesses to model relationships between variables, predicting future outcomes based on historical data.
PSPP in Other Fields
The applications of PSPP extend beyond social science and business. Researchers in fields like education, healthcare, and environmental science can leverage PSPP’s statistical capabilities. For example, educators might use PSPP to analyze student performance data, identifying factors that contribute to academic success or failure. Healthcare professionals could use PSPP to analyze patient data, identifying trends and patterns in disease prevalence or treatment outcomes.
Environmental scientists could utilize PSPP to analyze environmental data, such as air and water quality, to identify pollution sources and assess the effectiveness of mitigation strategies. The versatility of PSPP makes it a valuable tool across a wide range of disciplines.
Troubleshooting Common PSPP Issues
PSPP, while generally robust, can sometimes throw curveballs. Understanding common errors and debugging techniques can save you significant time and frustration. This section will cover frequent problems, solutions, and strategies for smoothing out your PSPP workflow.
Common PSPP Errors and Solutions
A range of issues can arise during PSPP use, from simple data entry mistakes to more complex problems with syntax or file compatibility. Addressing these issues efficiently requires a systematic approach.
- Error: “File not found.” This often occurs when you’ve misspelled the file name or path, or the file isn’t in the directory you specified. Solution: Double-check the file name and path for typos and ensure the file exists in the correct location.
- Error: “Syntax error.” PSPP’s syntax is fairly strict. A missing comma, parenthesis, or incorrect command can trigger this. Solution: Carefully review the command line for errors. PSPP often provides a line number to help pinpoint the problem. Consult the PSPP documentation for correct syntax.
- Error: “Variable not found.” This means PSPP can’t locate a variable you’re referencing in your analysis. Solution: Verify the variable name (case-sensitive!) exists in your dataset and is spelled correctly. Check the variable’s type (numeric, string, etc.) to ensure it’s compatible with the command.
- Error: “Data type mismatch.” This happens when you try to perform an operation on variables with incompatible data types (e.g., adding a string to a number). Solution: Ensure all variables involved in the operation have compatible data types. You might need to use PSPP’s data transformation functions to convert variables to the appropriate type.
- Error: “Insufficient memory.” Working with very large datasets can exceed PSPP’s available memory. Solution: Consider reducing the size of your dataset (e.g., by selecting a subset of variables or cases), or upgrading your computer’s RAM.
Debugging PSPP Scripts or Macros
PSPP scripts and macros can be powerful tools, but debugging them can be tricky. Employing a systematic approach significantly increases your chances of identifying and fixing problems.
- Divide and Conquer: Break down complex scripts into smaller, more manageable chunks. This makes it easier to isolate the source of errors.
- Print Statements: Strategically insert `PRINT` statements within your script to display intermediate results. This allows you to track the script’s execution and identify points where errors occur.
- Comment Your Code: Adding comments to your script improves readability and helps you (and others) understand the logic. This is especially important for debugging complex scripts.
- Use the PSPP Debugger (if available): Some versions of PSPP may include a debugger that provides step-by-step execution and allows you to inspect variables. Consult the PSPP documentation to see if this feature is available in your version.
- Test Incrementally: After making changes to your script, test it thoroughly, preferably on a small, manageable dataset before running it on your full data.
Frequently Asked Questions about PSPP
Addressing common questions helps clarify potential roadblocks and promotes efficient use of the software.
- Question: How do I handle missing data in PSPP? Answer: PSPP offers several approaches to handle missing data, including listwise deletion, pairwise deletion, and imputation. The best method depends on the nature and extent of the missing data and the type of analysis being performed. Consult the PSPP documentation for details on each method.
- Question: Can PSPP handle large datasets? Answer: PSPP can handle relatively large datasets, but its performance might be affected by available system resources (RAM and processing power). For extremely large datasets, consider using more specialized statistical software or techniques to optimize memory usage.
- Question: How do I create custom graphs and tables in PSPP? Answer: PSPP provides tools for creating a variety of graphs and tables. The specific steps depend on the type of graph or table desired. The PSPP documentation provides detailed instructions and examples.
- Question: Where can I find more information and support for PSPP? Answer: The PSPP website (usually psp.gnu.org) provides extensive documentation, tutorials, and a community forum where you can ask questions and get help from other users.
Resources and Further Learning for PSPP
So you’ve conquered the basics of PSPP, and maybe even tackled some more advanced features. That’s awesome! But the journey of statistical analysis is a long one, and there’s always more to learn. This section will point you towards resources to continue expanding your PSPP skills and knowledge. We’ll cover helpful websites, online communities, and suggest a structured learning path to help you progress at your own pace.
Finding reliable and up-to-date information on PSPP can sometimes feel like searching for a needle in a haystack. Fortunately, several resources exist to aid your learning journey, from official documentation to active online communities.
Helpful Websites and Documentation
The official PSPP website is, unsurprisingly, a great starting point. While not always the most visually appealing, it contains essential information such as the latest downloads, release notes, and often links to relevant documentation. Beyond the official site, you’ll find numerous tutorials and guides scattered across the web, though always double-check the date to ensure the information is current with the PSPP version you are using.
- The official PSPP website: This is your primary source for downloads, release notes, and sometimes links to helpful documentation.
- University websites and online course materials: Many universities incorporate PSPP into their statistics courses. Searching for university course materials on statistical analysis using PSPP can yield valuable resources.
- YouTube tutorials: While quality can vary, YouTube offers a wealth of video tutorials demonstrating various PSPP functions. Be sure to check the upload date and the number of views/likes to gauge reliability.
PSPP Communities and Forums
Connecting with other PSPP users is invaluable for troubleshooting, sharing tips, and getting help with specific problems. While dedicated PSPP forums might be less common than those for more established software packages like SPSS, you can often find helpful discussions within broader statistical analysis communities.
- Stack Overflow: While not exclusively for PSPP, Stack Overflow is a great resource for asking and answering questions about programming and data analysis, including issues related to PSPP. Remember to provide sufficient context and details when asking a question.
- University online forums and discussion boards: Many university courses using PSPP have associated online forums where students and instructors can discuss course material and troubleshoot problems.
- Social media groups: Search for PSPP-related groups on platforms like Facebook or Reddit. These groups can be a great place to connect with other users and share tips and tricks.
Structured Learning Path for PSPP Beginners
A well-structured approach can significantly improve your learning experience. This suggested path prioritizes a gradual increase in complexity, ensuring you build a solid foundation before tackling more advanced topics.
- Familiarize yourself with the interface: Start by exploring the PSPP interface, understanding the different menus and windows. Practice opening and saving files.
- Data import and export: Learn how to import data from various sources (e.g., CSV, Excel) and export results in different formats.
- Basic data manipulation: Master essential data manipulation techniques such as recoding variables, creating new variables, and filtering data.
- Descriptive statistics: Learn to calculate and interpret descriptive statistics like mean, median, standard deviation, and frequencies.
- Inferential statistics: Gradually progress to inferential statistics, starting with simpler tests like t-tests and moving on to more complex analyses like ANOVA or regression.
- Data visualization: Learn to create charts and graphs to effectively visualize your data and communicate your findings.
- Advanced features: Once you’re comfortable with the basics, explore more advanced features like syntax, scripting, and macros.
Last Recap
So there you have it – a whirlwind tour of PSPP! From its humble beginnings as an open-source alternative to its current capabilities, PSPP has proven itself a versatile and powerful tool for data analysis. Whether you’re a seasoned statistician or just starting out, PSPP offers a user-friendly interface and a comprehensive set of features to help you unlock the insights hidden within your data.
Now go forth and analyze!
Helpful Answers
Is PSPP compatible with Mac/Linux/Windows?
Yes, PSPP is cross-platform and works on Mac, Linux, and Windows.
How much does PSPP cost?
It’s free! Completely open-source and available for download.
Can I import data from a .sav file (SPSS)?
While not directly, you can often convert .sav files to other formats (like CSV) that PSPP can import.
What if I get stuck? Where can I find help?
The PSPP website has documentation and there are online forums and communities dedicated to helping users.
Does PSPP have a command line interface?
Yes, PSPP offers a command-line interface for advanced users and scripting.